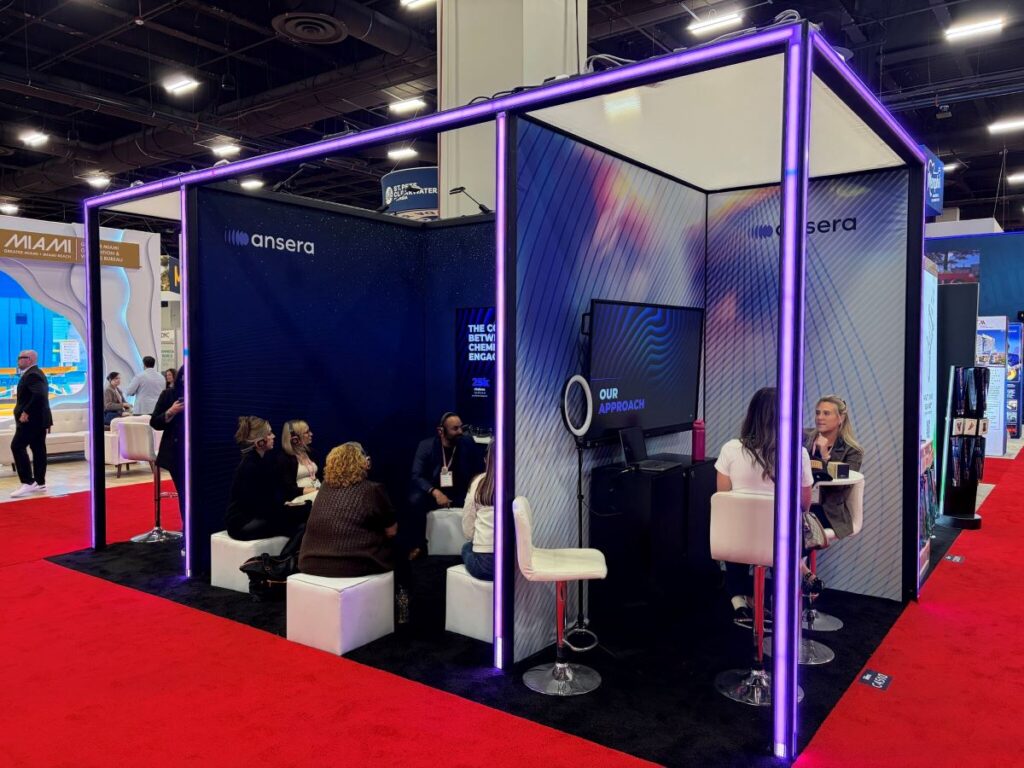
At IMEX America 2026, we ran our Run of Show Diagnostic live so planners could see how event agenda design plays out before the first session starts.
Every agenda has an energy curve. There are places where energy rises and places where it dips. There are moments when the program asks people to absorb the most at exactly the time they have the least left.
When a room goes flat at 2:30 in the afternoon, a post-event survey can explain why after everyone has gone home. The Run of Show (RoS) Diagnostic shows you that curve before you spend a dollar on production.
At IMEX America in Las Vegas, we hosted live sessions of the diagnostic, walking a room of planners through how it works and reading a real report together.
The Short Version
- The RoS Diagnostic reads an agenda like a blueprint. It checks sequencing, demands on attendees, and emotional arc before production begins.
- Four dimensions are scored from 0 to 100. Attention, participation, flow, and emotional impact each get their own score.
- Every report includes five findings and a focus map. You get an overall score with a range, five findings (always including a real strength), and a map of where to focus first.
- It’s honest by design. Every finding names its research, every score comes with a range, and the report measures the conditions for peak moments.
- Titles and times are enough to start. More context makes the read sharper.
The Research Behind the Run of Show Diagnostic
The diagnostic sits on top of Ansera’s research foundation: an Engagement Framework, a library of 56 source studies, and a ledger of 59 rated, defensible claims. It’s powered by AweBot, our proprietary AI assistant for crafting high-impact experiences.
The framework recognizes three states that run through every experience arc:
- Curiosity is the sustained baseline. It depends on psychological safety.
- Deep engagement is the activated state, when people stop watching and start feeling. It comes in bursts around activated programming.
- Awe is the peak state: rare, brief, and powerful enough to change how people see. It spikes three or four times across an event.
The design job is simple to say and hard to do: design the baseline, then schedule the peaks.
How the Diagnostic Scores Event Agenda Design
Each dimension is scored from 0 to 100:
- Attention: Are sessions short enough to hold focus, are there enough resets, and is any one voice on stage too often?
- Participation: How much of the day asks people to do something, and is networking designed into the program?
- Flow: Does the day build toward something, and is there room to process before the next session?
- Emotional impact: Shared moments, a designed close, and a story that connects across the whole brand experience.
The diagnostic reads the conditions for peak moments: whether the agenda leaves room for them and builds toward them.
“Told once, it’s a speech. Told across three days, it’s the event.”
A Real Read: What the Diagnostic Found in a Three-Day Conference Agenda
In the session, we ran the diagnostic on a real three-day conference for 515 attendees, using the full agenda and creative brief. Client details are removed. Here’s what came back:
- Overall score: 65, functional but fatiguing, with a range of 63 to 67 and high confidence.
- Dimensions: attention 72, flow 70, emotional impact 60, and participation 58.
The Numbers Behind the Score
The counts pulled straight from the agenda told the story:
- Only about 20% of the time asked people to do something. The rest was listening.
- Two mornings ran 105 minutes seated.
- One presenter appeared in four of nine sessions.
- Recognition, the reason the event existed, shared 15 minutes with opening remarks.
Two Findings and a Real Strength
The first finding was a gap. Recognition was the point of the event, yet it was folded into the opening. People remember the peak and the end of an experience, so the honoring should have been the peak.
The second was a risk. A change message came before the applause, with 90 minutes of strategy and role change early on, and the safe, anonymous questions came a day later. Celebrate first, and people stay open.
Every report also names a real strength. Here it was recovery and choice: sessions averaged 36 minutes, the longest ran 60, there were five breaks on the first day, and attendees could choose among electives and outdoor breakfasts.
Three Moves to Raise the Score
- Make the honoring the high point.
- Tell the event’s central story across all three days.
- Put leaders at the tables as well as on the stage.
Then rerun the diagnostic on the new draft before the run of show is locked. A two-minute survey after the event shows whether it worked.
Honest by Design: The Rules Behind Every Report
Planners have seen a lot of vendor science, so we hold the diagnostic to a few rules:
- Every finding names its research. Findings without a traceable source stay out of the report.
- Every report names a real strength. That keeps the read balanced and useful.
- Scores come with a range. Less input means a wider range, so the precision always matches the evidence.
- Peak moments are read as conditions. The report shows whether the agenda makes room for them.
- Our benchmarks are labeled as ours. They’re built from research and Ansera’s own portfolio, and we say so.
The findings draw on research including work on attention (Farley, Risko, and Kingstone, 2013), active participation (Freeman et al., 2014, a 225-study analysis), flow (Csikszentmihalyi and LeFevre, 1989), and memory and shared moments (Kahneman et al., 1993; Páez, Rimé et al., 2015).
How to Get Your Event Agenda Scored in Three Steps
- Share the agenda.
- Answer five quick questions: event type, attendees, days, materials, and objective.
- Get the read.
Titles and times are enough to start. Add session descriptions or a speaker list and it gets sharper. Add scripts, objectives, or full program context and it’s as sharp as it gets. Client agendas stay confidential and are reviewed privately.
Questions Worth Asking
What does good event agenda design look like?
It balances listening with participation, builds toward a clear peak, and leaves room to reset between sessions. The strongest agendas plan the close as deliberately as the opening.
How do you improve audience engagement at a conference?
Start with the agenda: shorter sessions, more moments that ask attendees to do something, and fewer long seated blocks. A 225-study analysis by Freeman and colleagues found active learning outperformed lecture-based teaching in STEM courses, which is why participation is one of the four scored dimensions.
When should you run a Run of Show Diagnostic?
Run it on the first full draft, before production spending begins, then again after revisions. A post-event survey closes the loop by showing whether the changes worked.
What should you ask a live event production company about your agenda?
Ask how they evaluate pacing, participation, and the placement of the event’s peak moment. Ask what research their recommendations are based on.
Live Event Production That Starts With the Agenda
Reading an agenda this way is part of the live event production thinking we bring to every program, from leadership offsites to large-scale conferences, alongside the full range of our event production services. The diagnostic is free, and every read ends with a clear place to start.
Want your own agenda scored? Schedule Your Run of Show Diagnostic
Written by Marisa Brink
While You’re Here